

Mexican domestic market: 1H 2020 highlights
Volaris and Vivaaerobus take the lead as two other players continue restructuring
Unlike most of the other countries in Latin America, with the exception of Brazil, the Mexican government has not imposed a lockdown. This article reviews the performance of Mexican domestic airline operations in the first half of 2020 to ascertain how the industry is performing and to identify potential first mover advantage in a domestic-led aviation recovery.
In the first half of 2020, a total of 13.3 million domestic passengers were carried, significantly lower than the 25.6 million who travelled in the first half of 2019. Although traffic volumes are growing it still shows a drop of 48% to pre-crisis levels when compared on a semester-to-semester basis. The figure below clearly illustrates that Volaris and Vivaaerobus are performing better than its domestic peers.

Figure 1: Mexico passenger carried, domestic operations. Source: OAG Traffic Analyzed. Mexican CAA 1H 2019-2020. Note: Transportes Aéreos Regionales(TAR). Numbers are in 000.
While domestic passenger volumes decreased 8% between January and February 2020, the market collapsed in March and April with volumes down by 23% and 87% respectively month-on-month. The worst impact was felt in April as traffic volumes hit rock bottom, and the domestic market started to bottom out at the end of May, showing the first positive traffic growth with 500,000 passengers carried in June 2020, a figure not seen since March 2019.
In terms of market share, Volaris has achieved its highest ever share grabbing 50% of the market in June 2020, as shown in figure 2, with an impressive 19% point surge when compared to June 2019 and 11% from May 2020. In fact, the first time ever Volaris took a market share lead compared to Aeromexico was on January 2017 when it grabbed 31% share while its Full-Service Carrier (“FSC”) competitor reached 29%.

Figure 2: Mexico passenger traffic market share, domestic operations. Source: OAG Traffic Analyzed. Mexican CAA 2019-2020. Notes: Top 4: Volaris, Aeromexico, Vivaaerobus and Interjet. MS: Market Share. Other domestic players: Aéreo Calafia, Aeromar, Magnicharters and TAR.
Even before the pandemic struck, since September 2018, Volaris has been the largest domestic player with a 29% market share and with at least a 1%-point lead on Aeromexico. In fiscal 2018 Volaris carried 355,000 more domestic passengers than Aeromexico and by the end of 2019, the Volaris market share reached 31%, for a 7%-point lead from its FSC competitor, and transported 3.8 million additional domestic passengers.
As the Mexican government warned about the risk of a country-wide outbreak in late February, airlines began cutting domestic capacity. By May 2020, capacity was at 19% of the volume in May 2019 Capacity rose significantly in June 2020, however, reaching 45% of the previous year with 1.4 million more seats than in May 2020, based on OAG data. Furthermore, figure 3 shows that all airlines but Aéreo Calafia have added capacity at a pace above 95% month-on-month basis in June 2020. In fact, Vivaaerobus and Volaris are capacity growth leaders.

Figure 3: Mexico seat capacity, domestic operations. Source: OAG Capacity data. May and June 2020. Numbers are in 000.
In this times of fragile demand and uncertain global economy, getting a "wrong pulse of demand" could have been disastrous for airlines which had parked aircraft rather than operate them in preceding months so as to preserve liquidity and contain costs. Fortunately, those extra 1.4 million seats added to the market in June 2020 were matched by a 130% jump in traffic volumes as 500,000 passenger were carried in June, up from 386,000 in May. However, load factors for second quarter 2020 deteriorated when compare to first quarter showing there is still room for improvement related to how much capacity is added back in a sustainable way to the market.
In term of load factors, figure 4 shows selected Mexican carriers. Domestic flight systemwide load factors averaged 85% in 2019 and indicate a deterioration in the second quarter of 2020 when compared to first quarter. However, Vivaaerobus and Volaris were able to cut capacity quicker than Aeromexico and Interjet did.

Figure 4: Selected Mexico carriers Load factor, domestic operations. Source: OAG, carrier quarter reports Q1 and Q2 2020.
Globally, airlines have been struggling in gauging how many seats to put out in the market. This has been exacerbated by government travel bans and quarantine mandates, although the Mexico government has not put such measures in place. Nevertheless, putting in the right level of seat capacity to match changing demand requirements due to sudden travel restriction in a pandemic era has led to a high rate of cancellations especially as airline management tries to optimize loads and route profitability. Today, the number of schedule changes and adjustments that airlines have had to make to stay on top of the crisis in such a short time is negatively impacting the industry and airlines are using different strategies to manage their schedule through this time.
Figure 5 below from OAG’s On Time Performance shows clearly that last minute flight cancellations rose sharply before the end of March 2020 and preceded the rise based on confirmed cases in Mexico. The number of cancelled flights remained high especially in April and May as airlines made rapid changes to their schedules, reducing the number of scheduled domestic flights from almost 94,500 in April 2020 to just 36,150 in May. Similarly, Volaris and Vivaaerobus reduced the number of scheduled domestic flights in May 74% and 47% respectively when compared to April 2020.

Figure 5: Selected Mexico carriers OTP, domestic ops. Daily flight operated/cancellations. Source: OAG OTP dashboard April/May 2020.
However, many airlines are using cancellations as a strategic tool. Filed schedules are left untouched except for weekly adjustments in the short term to help airline protect liquidity, especially where airlines postpone flights and offer passengers travel vouchers. This hidden sales tactic has been observed for example in Europe, Canada and Latin America.
Furthermore, the abnormally high rates of domestic flight cancellations for second quarter 2020 averaged 57% for Mexican carriers. However, the average rate for selected ULCCs/FSCs in the US is less than 30% as shown in figure 6.

Figure 6: Selected US carriers OTP, domestic operations. Daily flight operated, cancellations and unknown. Source: OAG OTP April/May 2020.
Conclusion
As we try to identify potential first mover advantage in a domestic-led aviation recovery, Volaris is clearly a domestic champion. In addition, Vivaaerobus is a key player and may take the opportunity to further consolidate its position as it offered more than 90% its pre-COVID ASKs in the Mexican domestic market while Volaris offered 69% by year end 2019. Volaris may also need to further slow down its international expansion and aggressively refocus resources in the domestic. One indication of this direction is its 50% share in the domestic market.
It is expected that Volaris share lead will continue due to the fact that its fleet (82 aircraft: 7 A319s, 59, A320s and 16 A321s) is 2.2 times larger than Vivaaerobus (38 aircraft: 18 Airbus 320ceo, 19 Airbus 320neo and the one recently added Airbus 321neo). However, both airlines have a strong foundation to emerge ahead of the competition from the crisis.
The Interjet, market share sunk hastily in March 2020 due to capacity constraints associated with return equipment to aircraft lessors, mounting debt, aircraft repossessions and liquidity issues. By April 2020, Interjet had cut capacity by 85%. It is expected that Interjet will commence a reorganization process through a recapitalization process under a new management team. It may also look for opportunities to strengthen ties with its new codeshare partner Aeromar through a merge in the future.
Aeromexico capacity was cut 74% in April as it sought to reduce systemwide capacity in order to mitigate lackluster demand conditions, preserve cash and prepare to file for bankruptcy protection. As its bankruptcy proceeding continues, Aeromexico might exit with one third of its fleet and 50% of its network as it aims to right size its business and focus on reducing cost and enhancing profitability. Therefore, the current positioning and future restructuring processes of both Interjet and Aeromexico will open the door for Volaris to further consolidate its domestic market share position while allowing Vivaaerobus to take soon the second largest domestic share behind Volaris.
However, both Vivaaerobus and Volaris need to focus on avoiding a neck-to-neck overcapacity race as they pursue domestic market share leadership. Returning capacity in a gradual and measured way, with limited cancellations and a sound and profitable schedule. When benchmarked with top ULCCs, international ULCCs typically derive more than US$50 per passenger while Volaris received US$25 p/pax in Q2 2020 (down from US$28 in Q1) and Vivaaerobus obtained US$28 p/pax in Q2 2020 (up from US$21 in Q1). Therefore, there is ample room for improvement and to expand their ancillary revenue strategies as they continue rebuilding passenger confidence and stimulate demand.
In spite of the strong organic demand of the Mexican domestic market in recent years which has seen a CAGR of 8% between 2015 and 2019, country GDP contraction, negative impact on disposable income, corporate travel budget reductions and continued regional border lockdowns may become an important obstacle for demand to accelerate both domestically and internationally. Furthermore, it may take up to 36 months for the domestic Mexican market to reach a its pre-crisis demand level especially as COVID-19 cases continue to rise as the next two figures show.

Figure 7: Mexico COVID-19 map and case count. Source: New York Times. Updated as Aug. 12th, 2020.
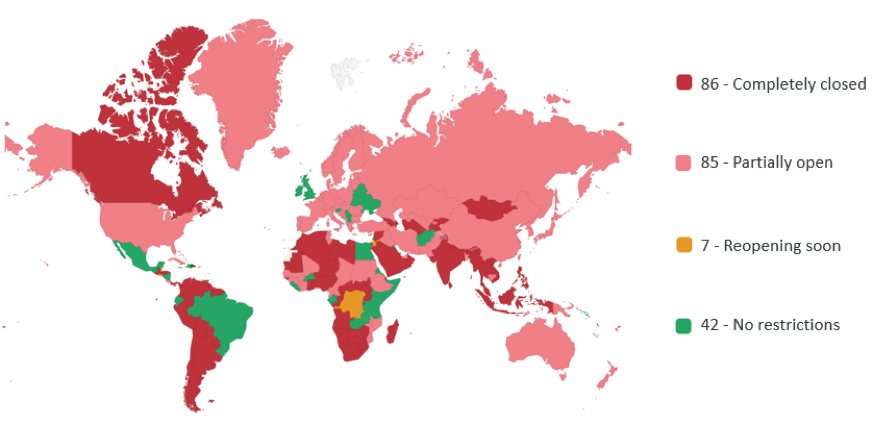
Figure 8: International travel restrictions by country. Aug 12th, 2020. Source: Kayak. Note: 00 indicates number of countries.
In the near to medium term, how the domestic market recuperates will be heavily influenced by the number of new COVID-19 cases, how they are contained and by when the curve will be flattened. With Mexico still grappling with high rates of infections, the future looks half promising for the next 18 months. The most successful Mexican carriers going forward will be those that are able to bring technology and resources while preparing to ramp up operations in the most cost-effective manner once regional borders reopen. However if by adding seat capacity (and its high related costs) too soon and getting the "wrong pulse of demand" they could put businesses at a higher risk of insolvency including bankruptcy or even closing doors.
- Rene' Armas Maes